Executive Summary
Renewed buying through spot Bitcoin ETFs strengthened Bitcoin’s recovery in Q3. Bitcoin rose 42.8%, closing September at $83,347 and narrowing its year-to-date decline to 4.52%, although it still trails broad equities for the year.
Returning demand supports further recovery, while higher interest rates and rising Treasury yields favor a more moderate pace. We now expect a year-end price near $100,000, approximately 20% above quarter-end and below our original $120,000 base case.
Tracking Our 2026 Bitcoin Outlook
Our 2026 Bitcoin outlook established three year-end scenarios:
$70,000 bear case, reflecting consolidation toward Bitcoin’s underlying cost basis.
$120,000 base case, representing continued growth along its long-term trend.
$160,000 bull case, reflecting renewed expansion above trend.

Q3 marked a significant shift in momentum.
Bitcoin traded below our bear-case price level throughout July before breaking above $70,000 in August. Despite renewed volatility in September, it finished the quarter at $83,347.
From that level, returning to $70,000 would represent a 16% decline, while reaching our base and bull cases by year-end would require advances of approximately 44% and 92%, respectively.
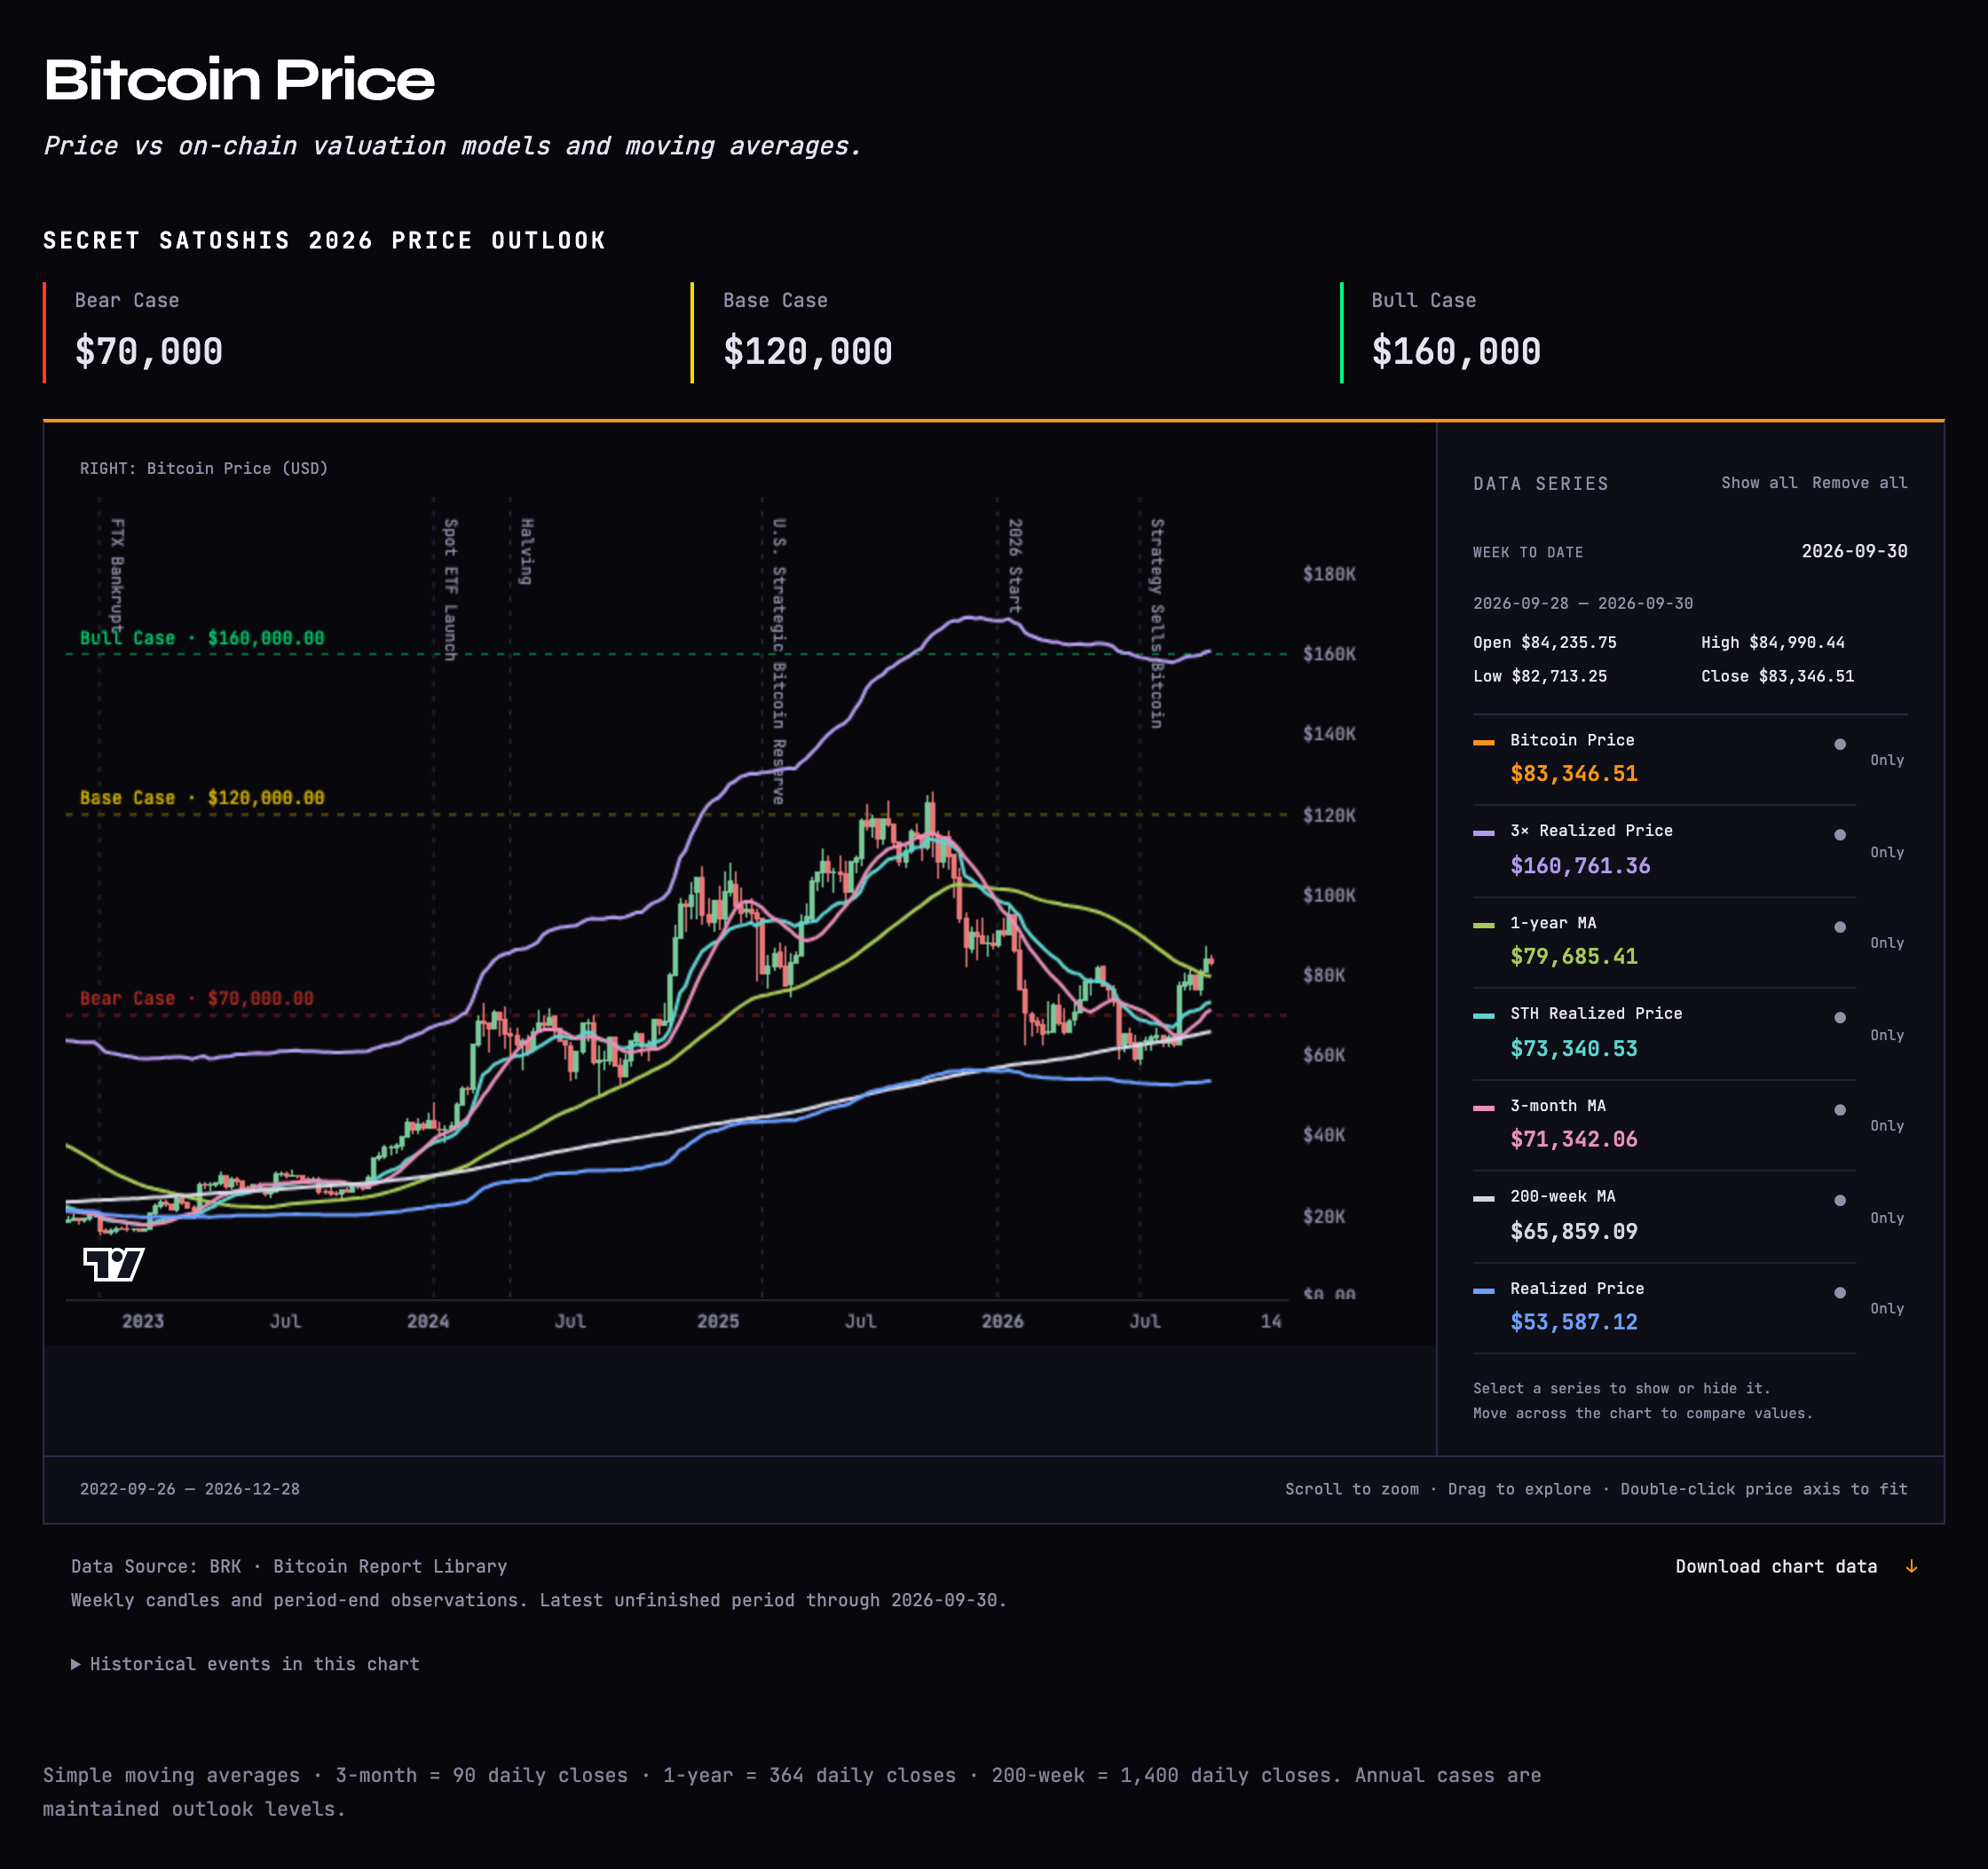
Bitcoin finished Q3 above its short-term holder cost basis of $73,341 and one-year moving average of $79,685, its first quarter-end above both since Q3 2025.
Recent holders were back in profit on average, while reclaiming the one-year average signaled improving momentum. Staying above both measures in Q4 would strengthen the recovery, a move back below would warn that momentum is weakening.
Together with Bitcoin remaining above its aggregate realized price of $53,587, these reclaimed levels support the case that the late-June low marked a market bottom.
Q3’s renewed buying and improving momentum strengthen that assessment heading into Q4.
Returning to the themes established in our 2026 outlook, Q3 changed the evidence on institutional buying and regulatory progress, with different implications for our year-end price assessment.
Institutional buying returns
What we expected: ETFs and other large holders would increasingly shape Bitcoin through their decisions to buy, hold or sell.
What happened:
Bitcoin ETFs ended an eight-week outflow streak in July, followed by approximately $1.9 billion in inflows during the end of August.
September’s $2.4 billion weekly inflow, the largest since October, pushed ETF flows positive for 2026.
Renewed ETF inflows provide the strongest near-term support for further price gains because they represent capital being allocated to Bitcoin now.
Continued buying through pullbacks would strengthen our expectation of further recovery in Q4, while persistent withdrawals would weaken that support and pull our assessment back toward the bear case.
Policy advances unevenly
What we expected: Implemented rules would reduce uncertainty and help banks and investors participate.
What happened:
The SEC outlined tailored rules and exemptions for crypto markets in August, while the Clarity Act failed a September Senate procedural vote.
The CFTC approved Coinbase’s clearinghouse for fully collateralized derivatives, excluding margined contracts.
The Clarity Act setback is a net negative for our outlook: it delays the broader framework that could support wider participation and weakens the policy catalyst behind our higher annual scenarios.
Coinbase’s clearing approval provides a smaller positive offset, with its limited scope carrying more weight for longer-term trading infrastructure than for our Q4 price assessment.
Updated Year-End Outlook
We expect Bitcoin to finish 2026 near $100,000 approximately 20% above quarter-end but below our original $120,000 base case.
Renewed ETF demand provides the strongest support for further gains. Reaching the base case would require an advance of nearly 44% in Q4, broadly comparable with Bitcoin’s 42.8% recovery in Q3. That makes continued buying and the financial backdrop central to whether Bitcoin can sustain a similar pace.
We expect the recovery to continue more moderately. The Fed’s September rate hike and rising long-term Treasury yields make interest-bearing assets more competitive, raising the hurdle for further Bitcoin allocations. Our estimate near $100,000 reflects a balance of returning ETF demand and financial conditions that continue to constrain its potential impact.
Sustained ETF inflows alongside stabilizing yields would strengthen the case for approaching our base case.
Renewed outflows or further tightening would increase the risk of reversing Q3’s gains.
Bitcoin in the Broader Market
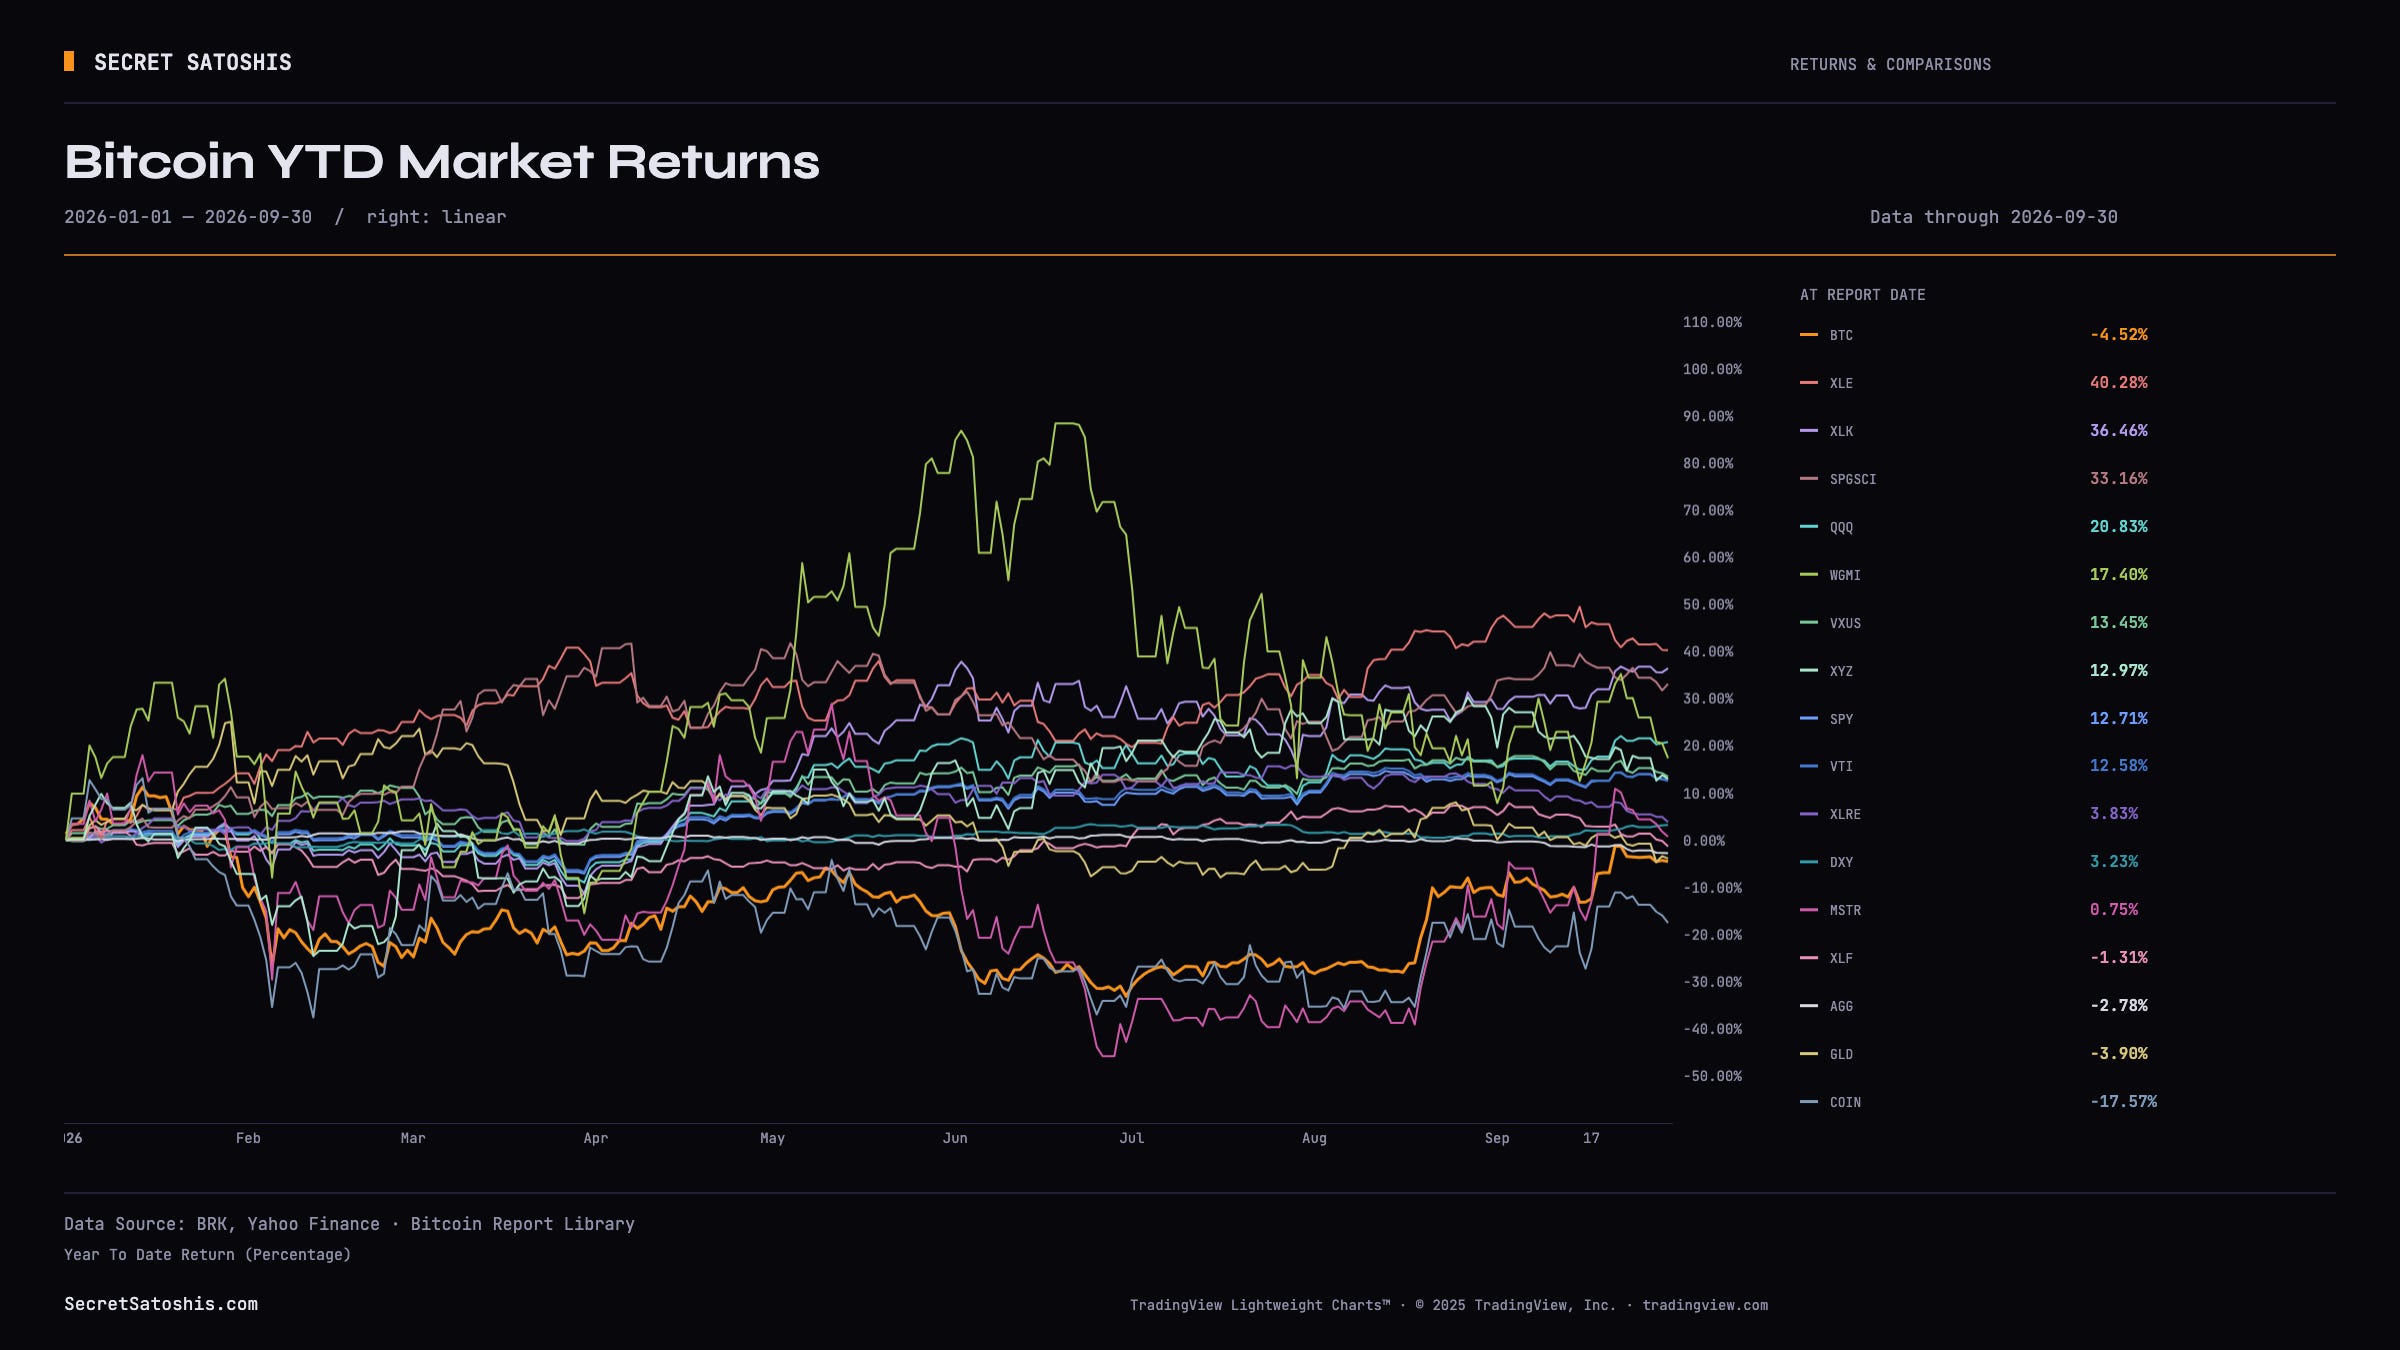
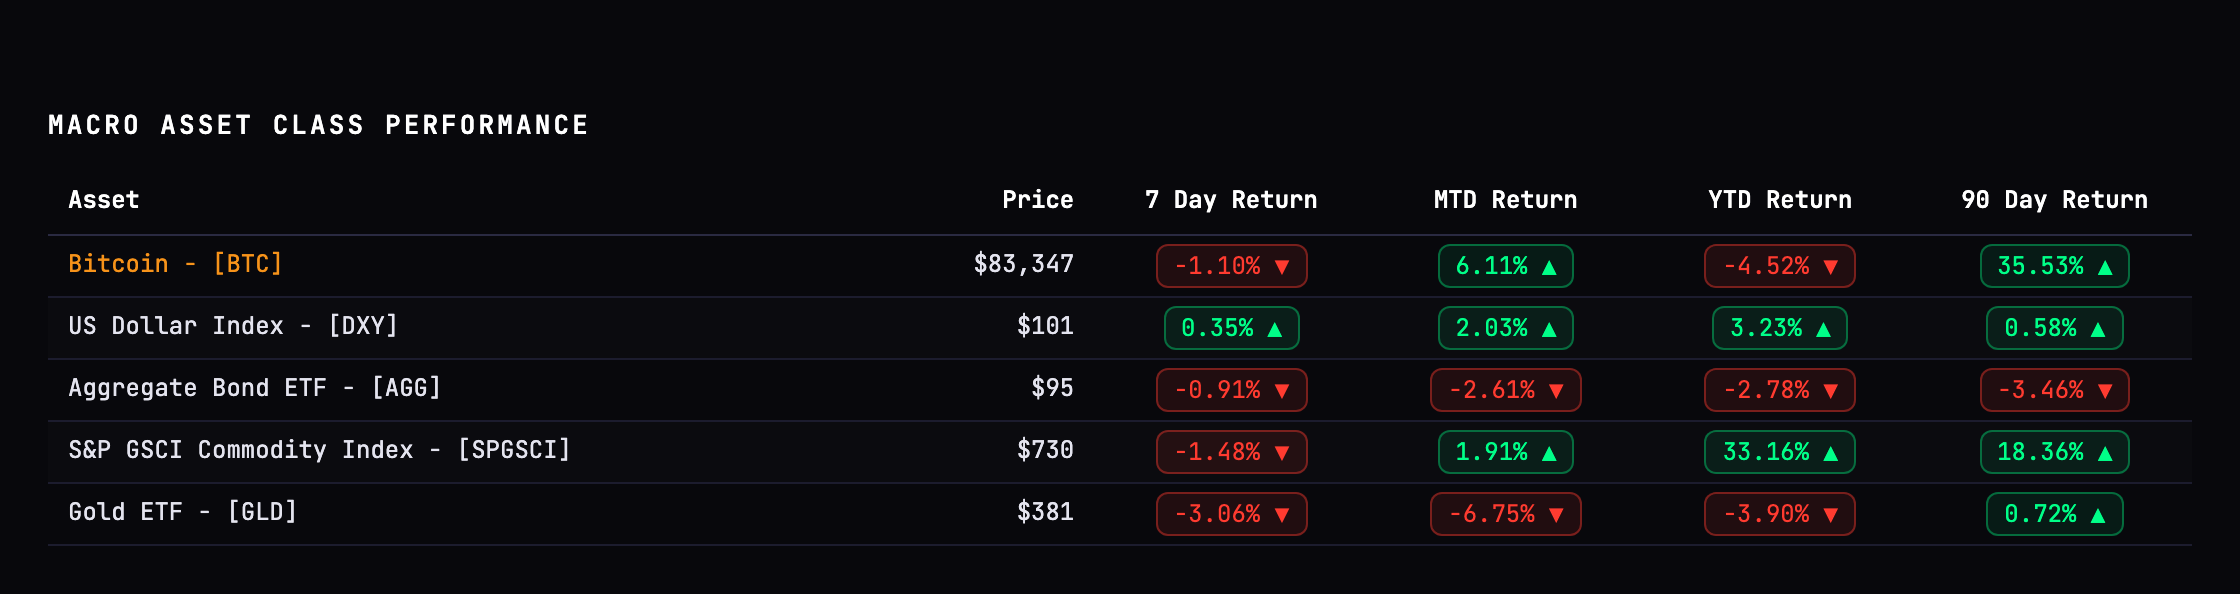
Bitcoin's 42.8% Q3 recovery narrowed its year-to-date decline to 4.52%, but performance remained behind broad equities and commodities.
Comparing Bitcoin with traditional markets highlights the contrast between its recent momentum and weaker performance across the full year.
Stock market indexes
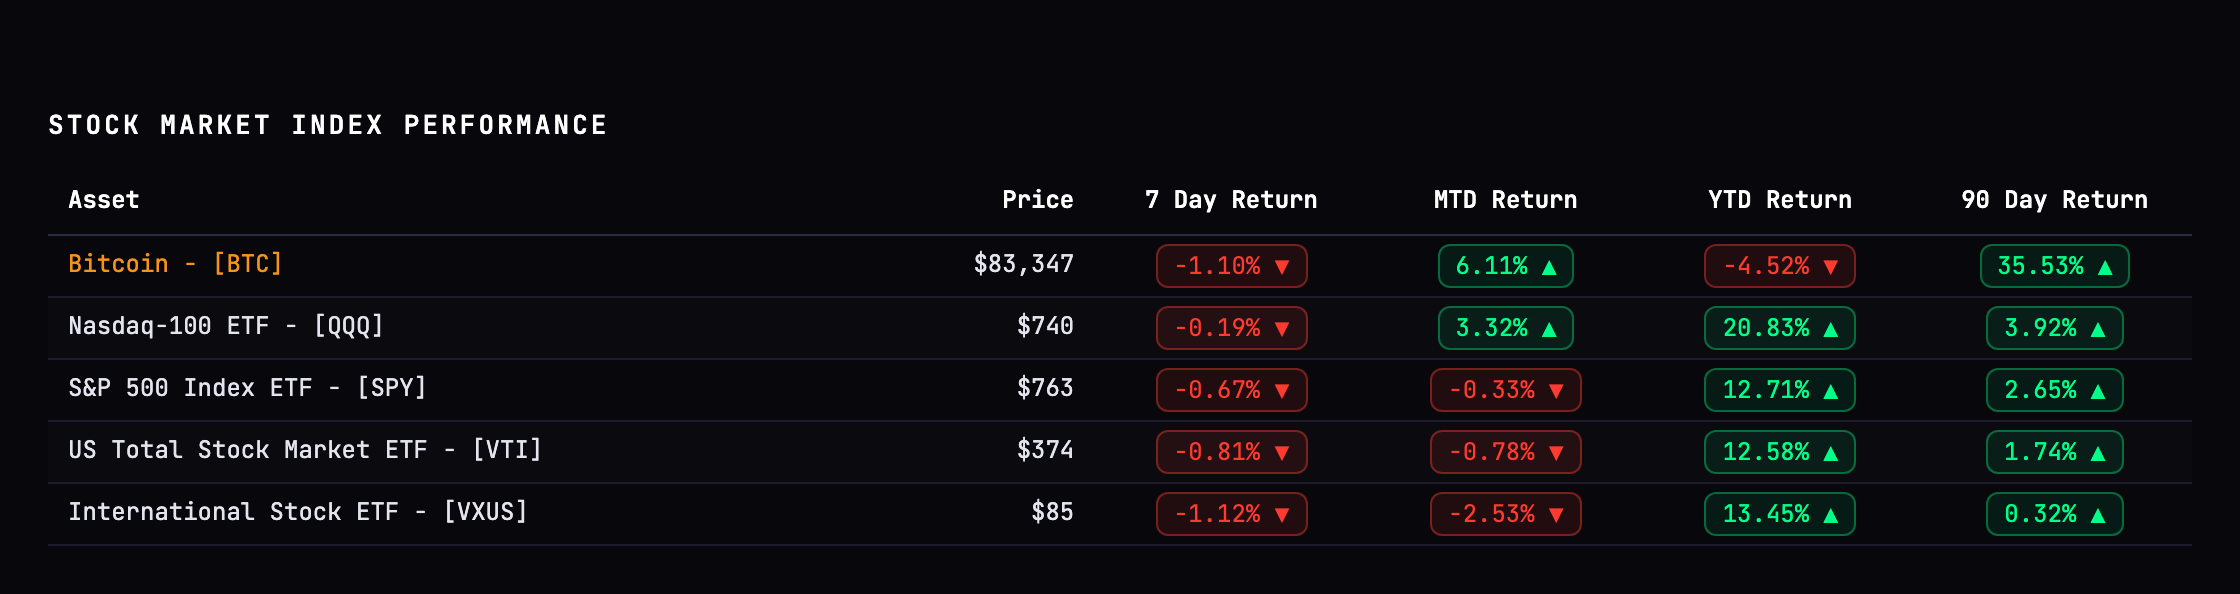
The S&P 500 ETF gained 12.71% and the Nasdaq-100 ETF rose 20.83% year to date, while Bitcoin declined 4.52%.
US total market and international equities also advanced, showing that Bitcoin’s underperformance occurred despite broad strength in global stock markets.
Equity sectors
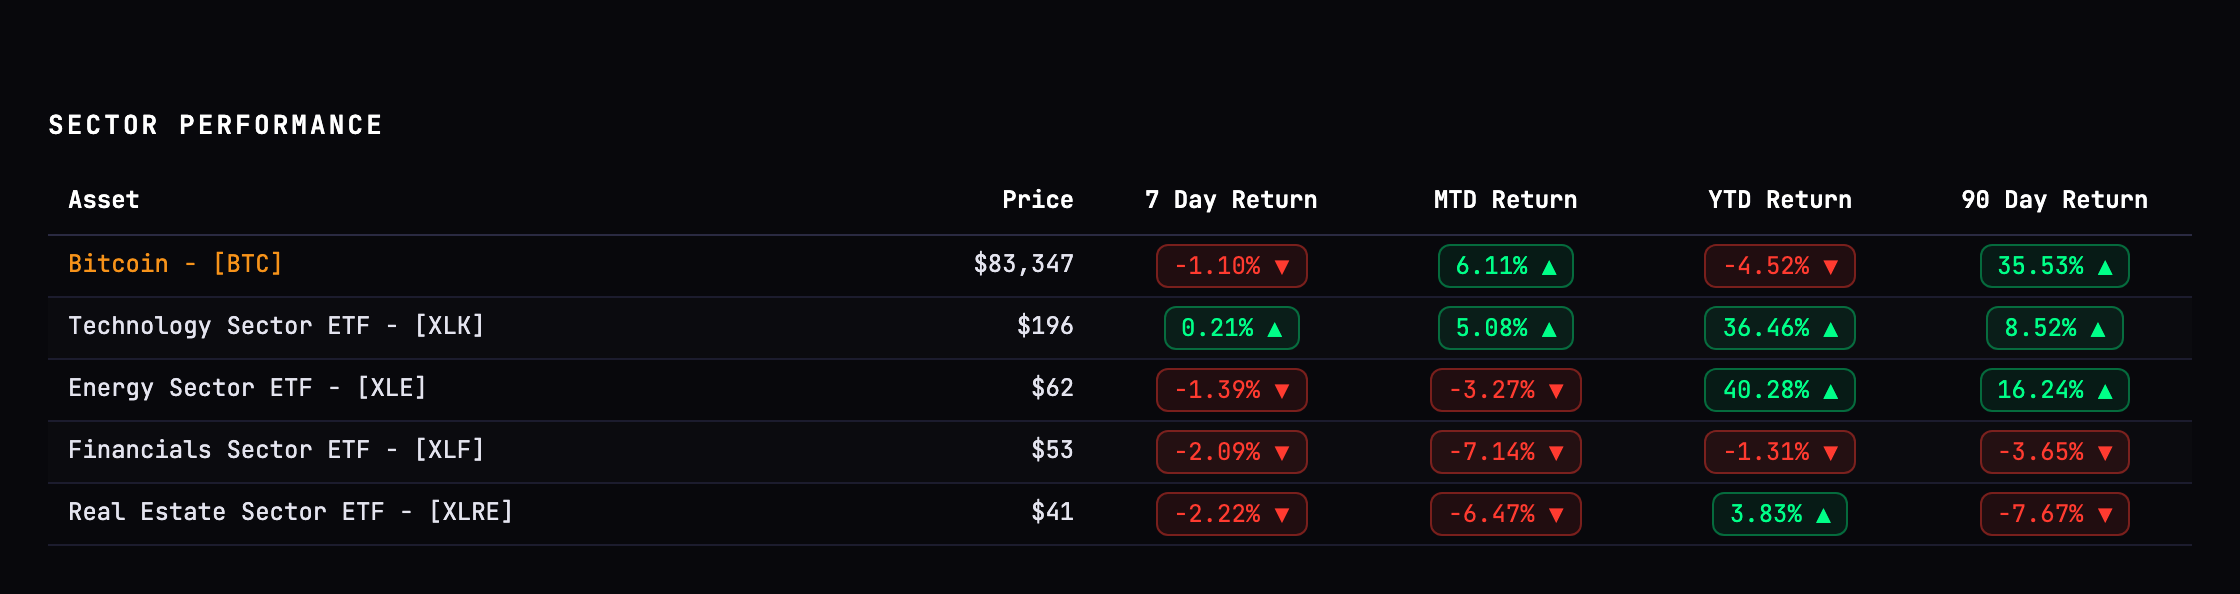
Energy led with a 40.28% gain, followed by technology at 36.46%, both significantly outperforming Bitcoin.
Technology’s strength alongside Bitcoin’s decline demonstrated that enthusiasm for growth-oriented assets did not necessarily translate into Bitcoin demand.
Macro assets
Commodities gained 33.16% year to date, while gold and bonds declined, although less sharply than Bitcoin.
Rising Treasury yields and a stronger US dollar added pressure to Bitcoin, highlighting its sensitivity to financial conditions even as other asset classes advanced.
Bitcoin-related equities
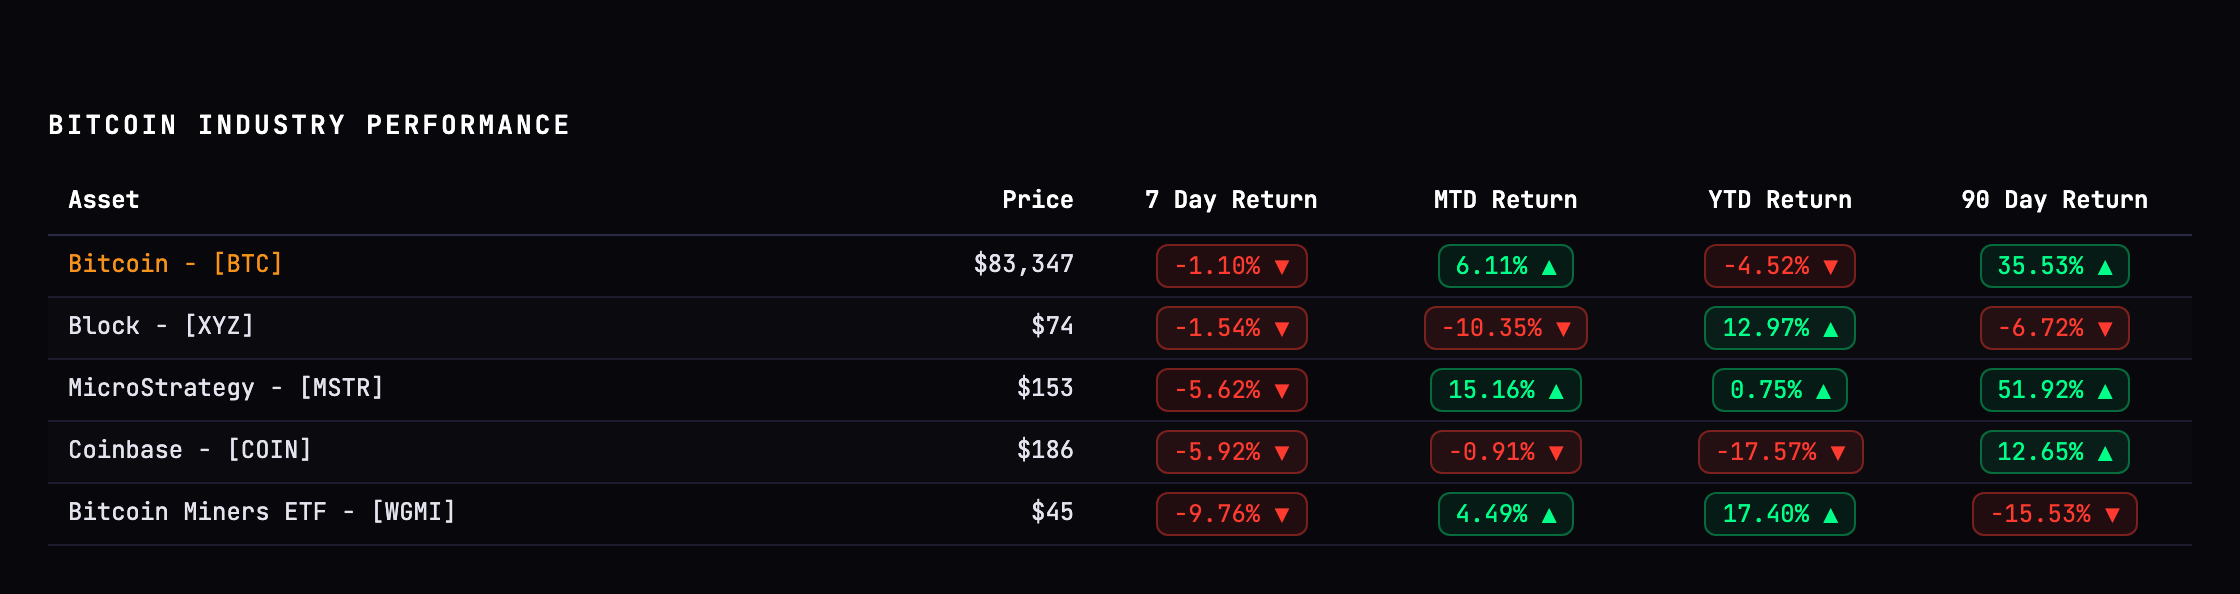
Strategy gained 0.75% year to date, while Coinbase declined 17.57%, underperforming Bitcoin itself.
The divergence illustrates how Bitcoin-related equities carry additional business, financing and valuation risks beyond direct Bitcoin exposure.
Q3 recovery shifts relative performance
Despite trailing most major benchmarks year to date, Bitcoin gained 35.53% over the trailing 90 days, substantially outperforming the Nasdaq-100 ETF’s 3.92% advance.
This reversal highlights improving relative momentum heading into Q4, although sustaining that strength will be necessary to close the year’s performance gap.
Bitcoin’s Place in the Global Asset Mix
At $1.67 trillion at quarter-end, Bitcoin’s market capitalization exceeded Saudi Aramco’s company valuation and the UK and Swiss monetary bases.
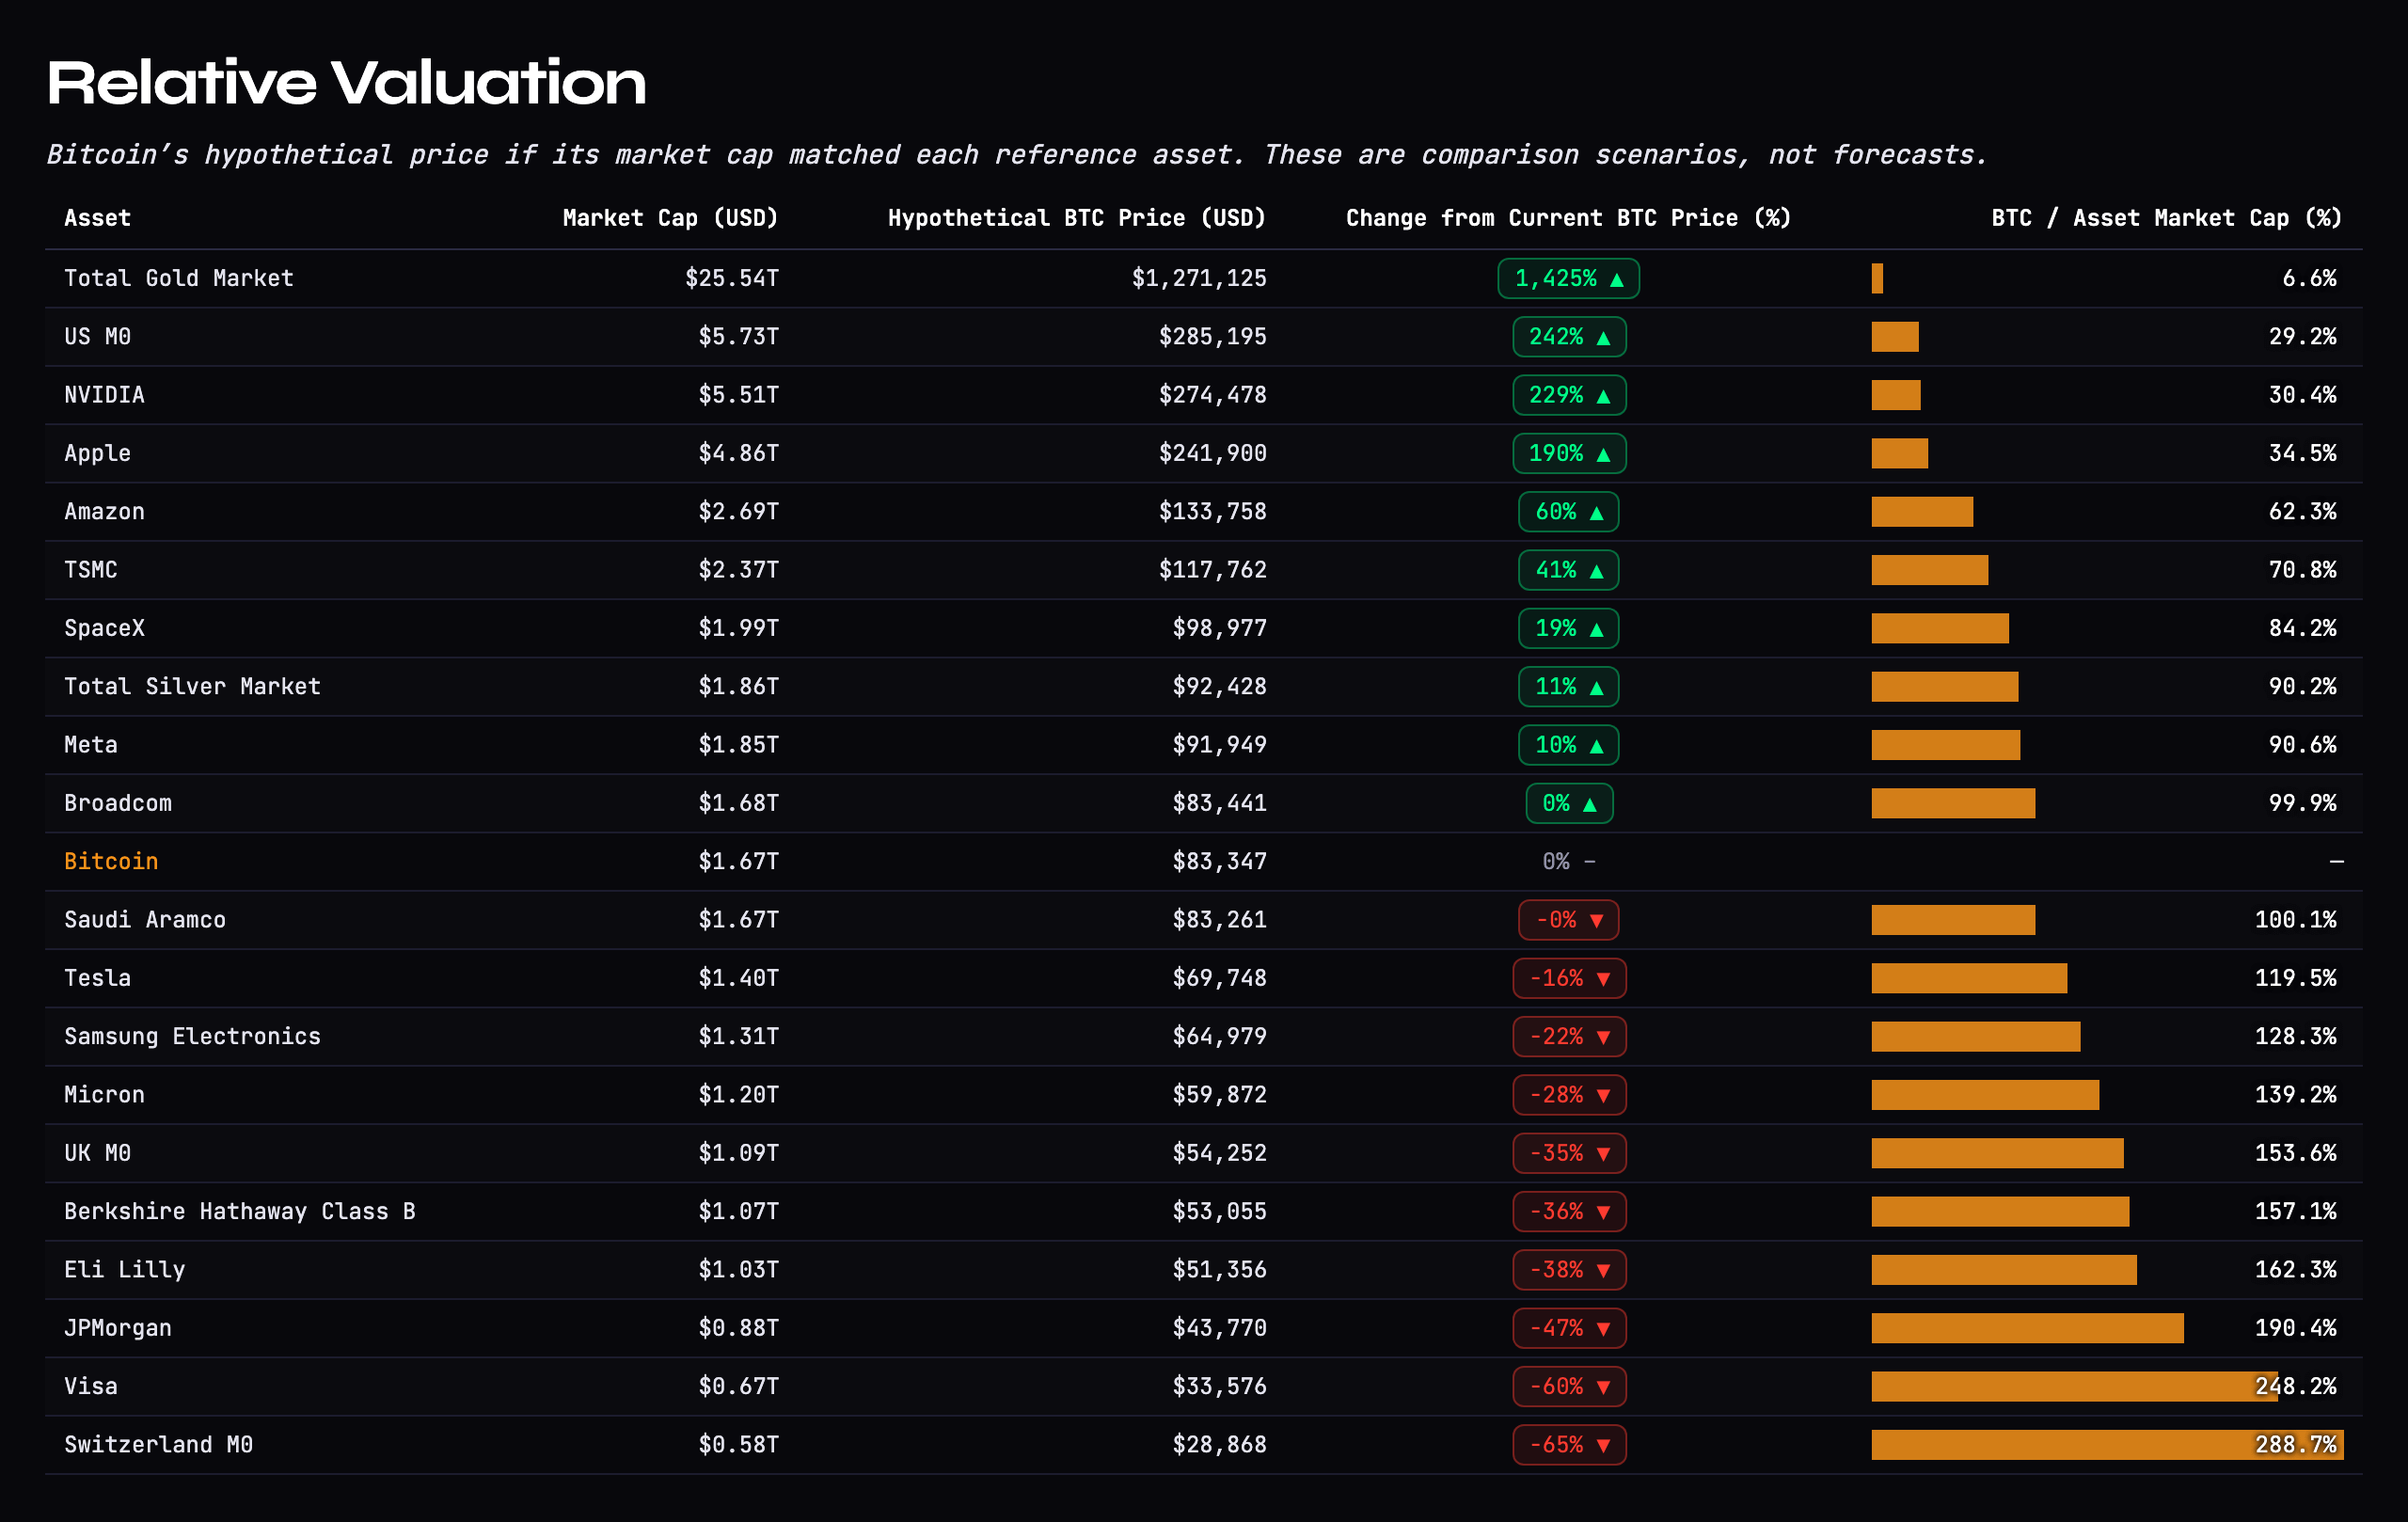
Broadcom and silver are the nearest larger size comparisons worth watching. Bitcoin’s position relative to them offers a concrete way to track its changing scale through Q4, alongside changes in those assets’ own valuations.
What We’re Watching Next
ETF buying and financial conditions carry the most weight in our Q4 price assessment. Broader regulatory progress could provide additional support. Three developments will shape our view:
ETF buying through pullbacks.
Continued inflows during price declines would strengthen the recovery’s demand support. Stronger, sustained buying would improve the case for approaching our original base case.
While persistent withdrawals would increase the risk of moving back toward the bear case.
Inflation relief translating into lower yields.
Softer inflation would become more supportive for our price outlook if it brings sustained relief in Treasury yields, reducing competition from interest-bearing assets.
Renewed yield increases would weigh against the stronger annual scenarios, even if ETF demand remains positive.
Broader regulatory progress.
A legislative framework becoming law and taking effect would carry more weight than additional narrow approvals because it could improve conditions for a wider group of participants.
Continued delays would keep the broader policy catalyst out of our near-term assessment, leaving buying demand to carry more of the recovery.
Our year-end review will assess whether these developments strengthened demand enough to move Bitcoin closer to our original base case, or whether financial pressure and weaker buying increased the downside risk.
Beyond our price outlook review, let’s check in on how our Bitcoin Savings Strategy is performing for subscribers.
The Bitcoin Savings Strategy
The strategy pairs consistent Bitcoin purchases with cash savings, building long-term ownership while maintaining liquidity, as outlined in Should I Buy Bitcoin?.

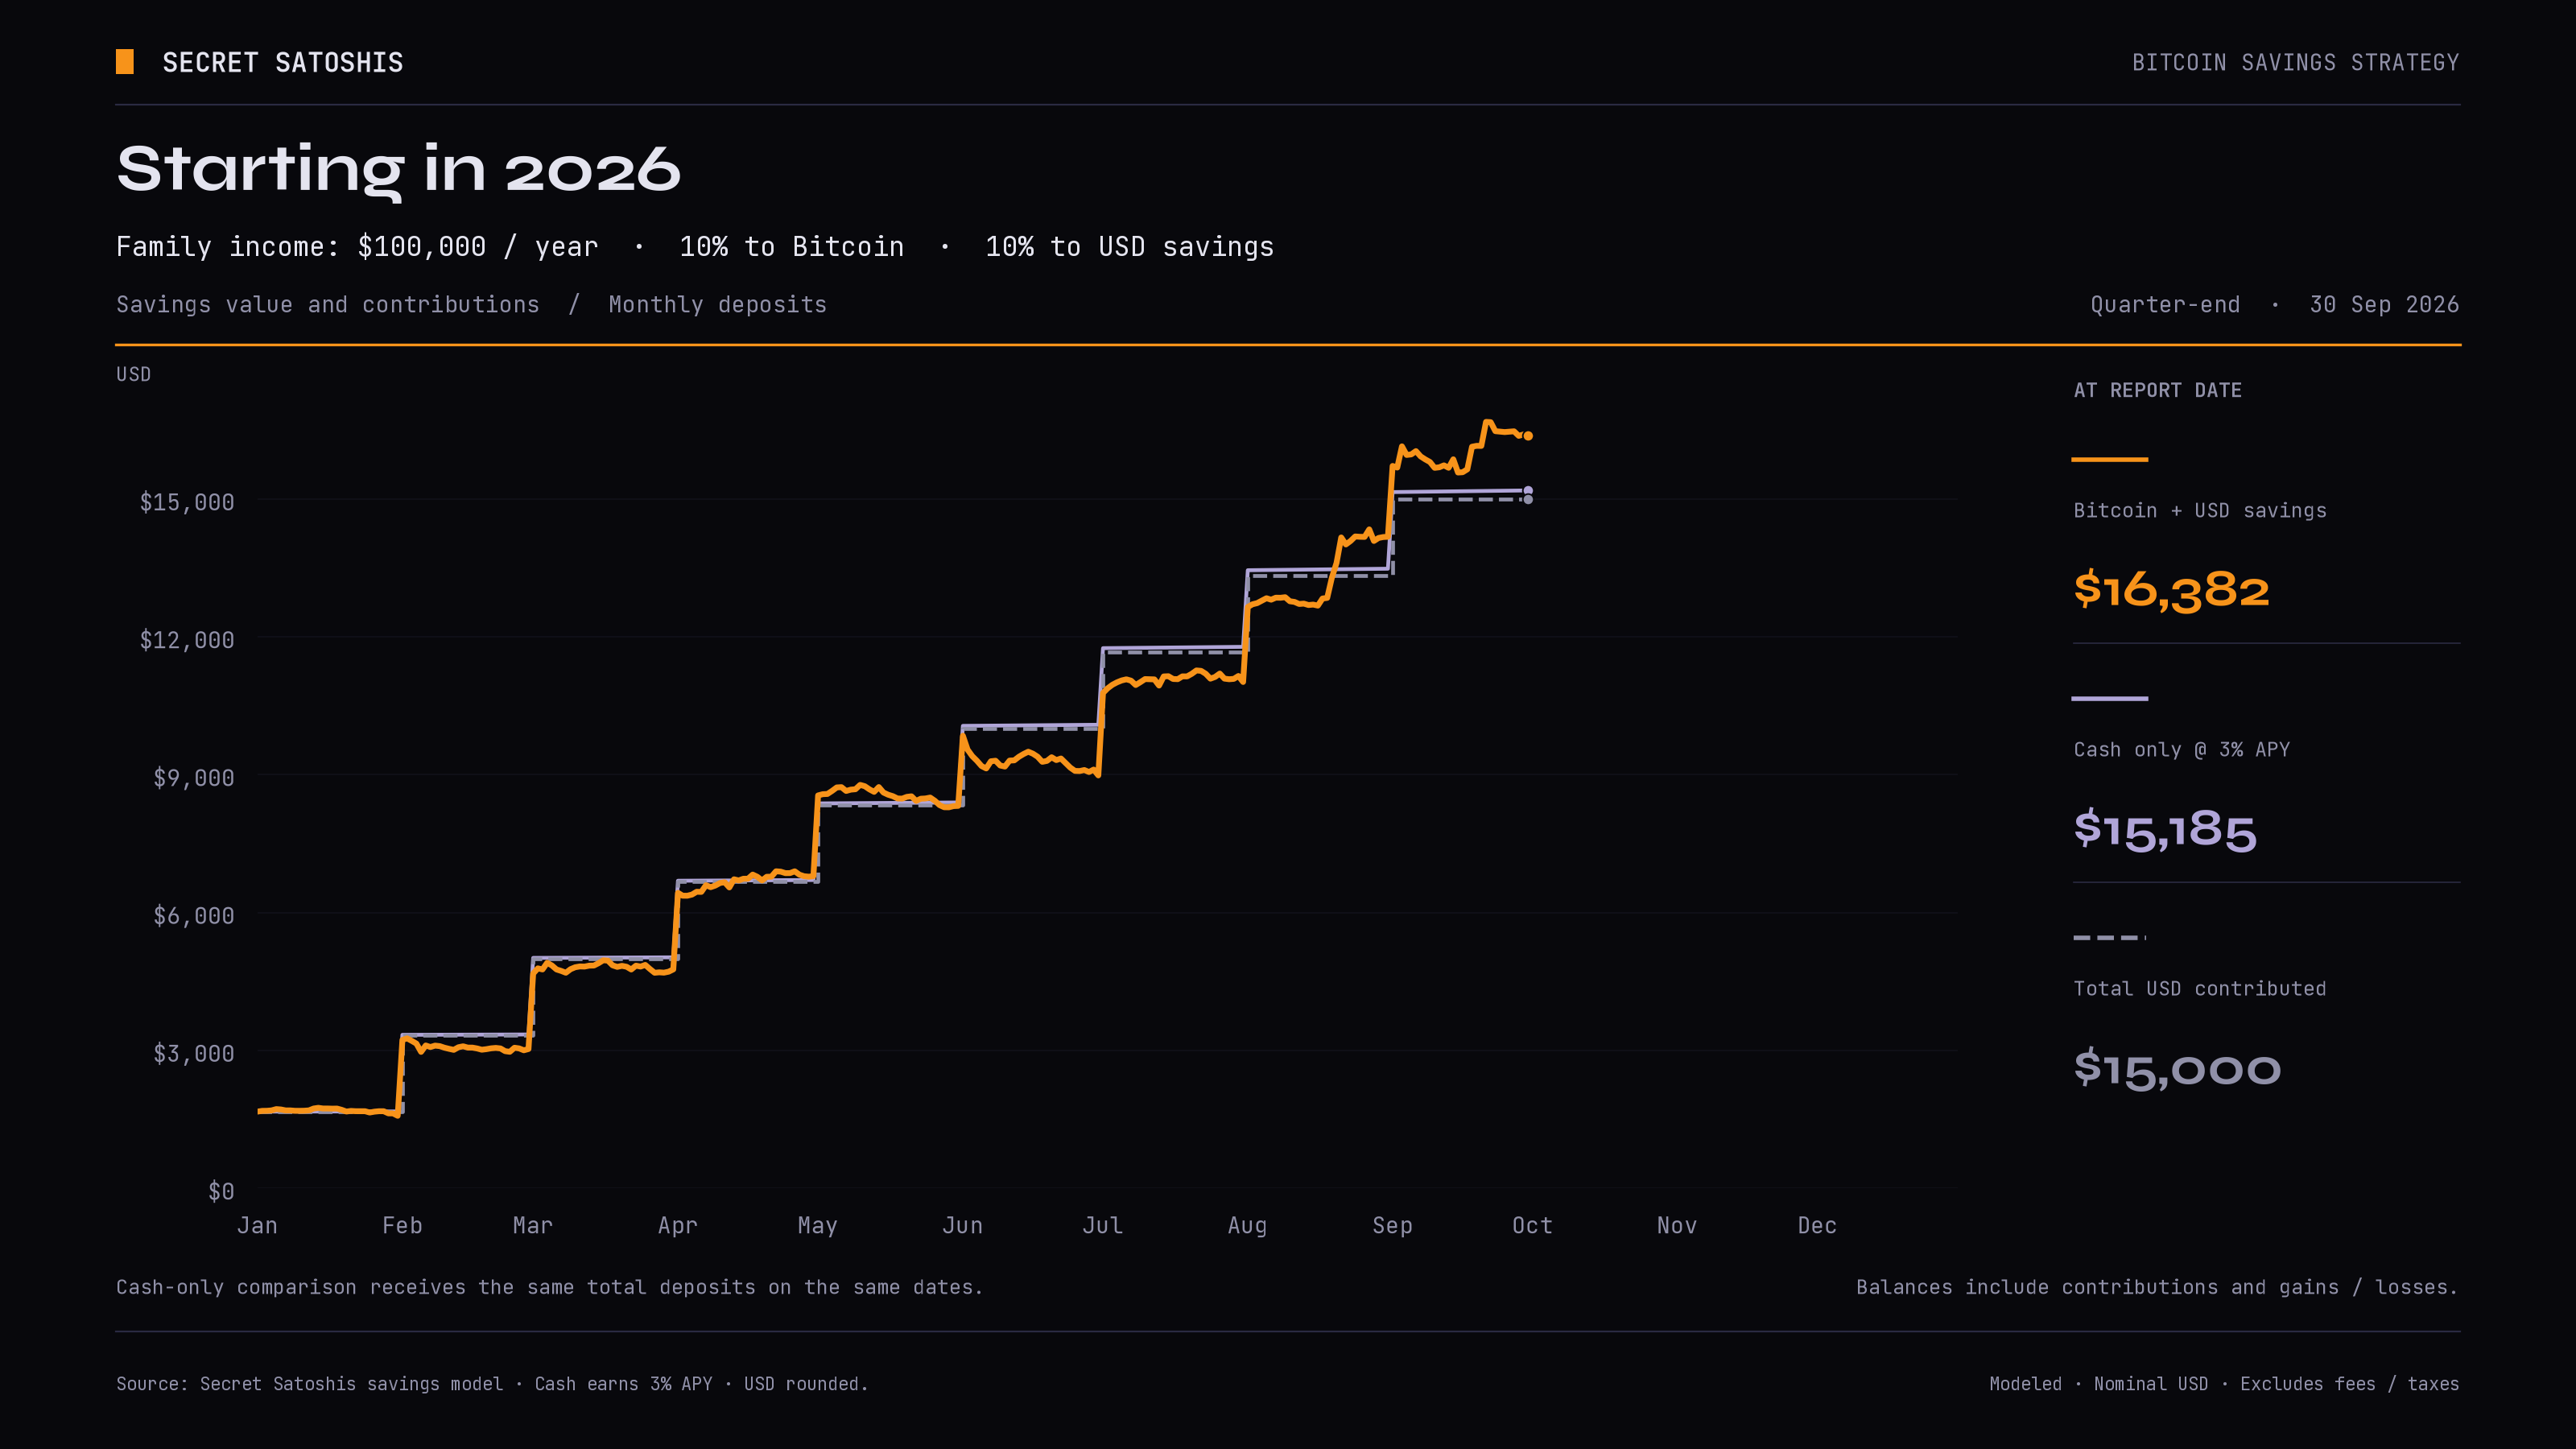
Assumptions: $100,000 annual household income; 10% of income contributed to Bitcoin and 10% to cash each month; cash earning 3% APY.
For a household beginning the plan in January 2026, the results through September 30 are:
Total contributed: $15,000
Bitcoin accumulated: 0.1055 BTC
Cash savings: $7,593, including interest
Combined savings value: $16,382
Gain above contributions: $1,382
The plan entered Q3 below total contributions before moving into positive territory during August’s recovery. Consistent purchases brought the average Bitcoin acquisition price to $71,122, illustrating how regular accumulation can benefit from lower prices without requiring investors to time the market.
Looking across starting years highlights the importance of time horizon. Households beginning in 2025 remain $831 behind an equivalent cash-only strategy, despite their combined savings exceeding contributions by $131.
Meanwhile, a household starting in 2022 has accumulated 1.1242 BTC and built a $51,055 cash reserve from $95,000 in contributions.
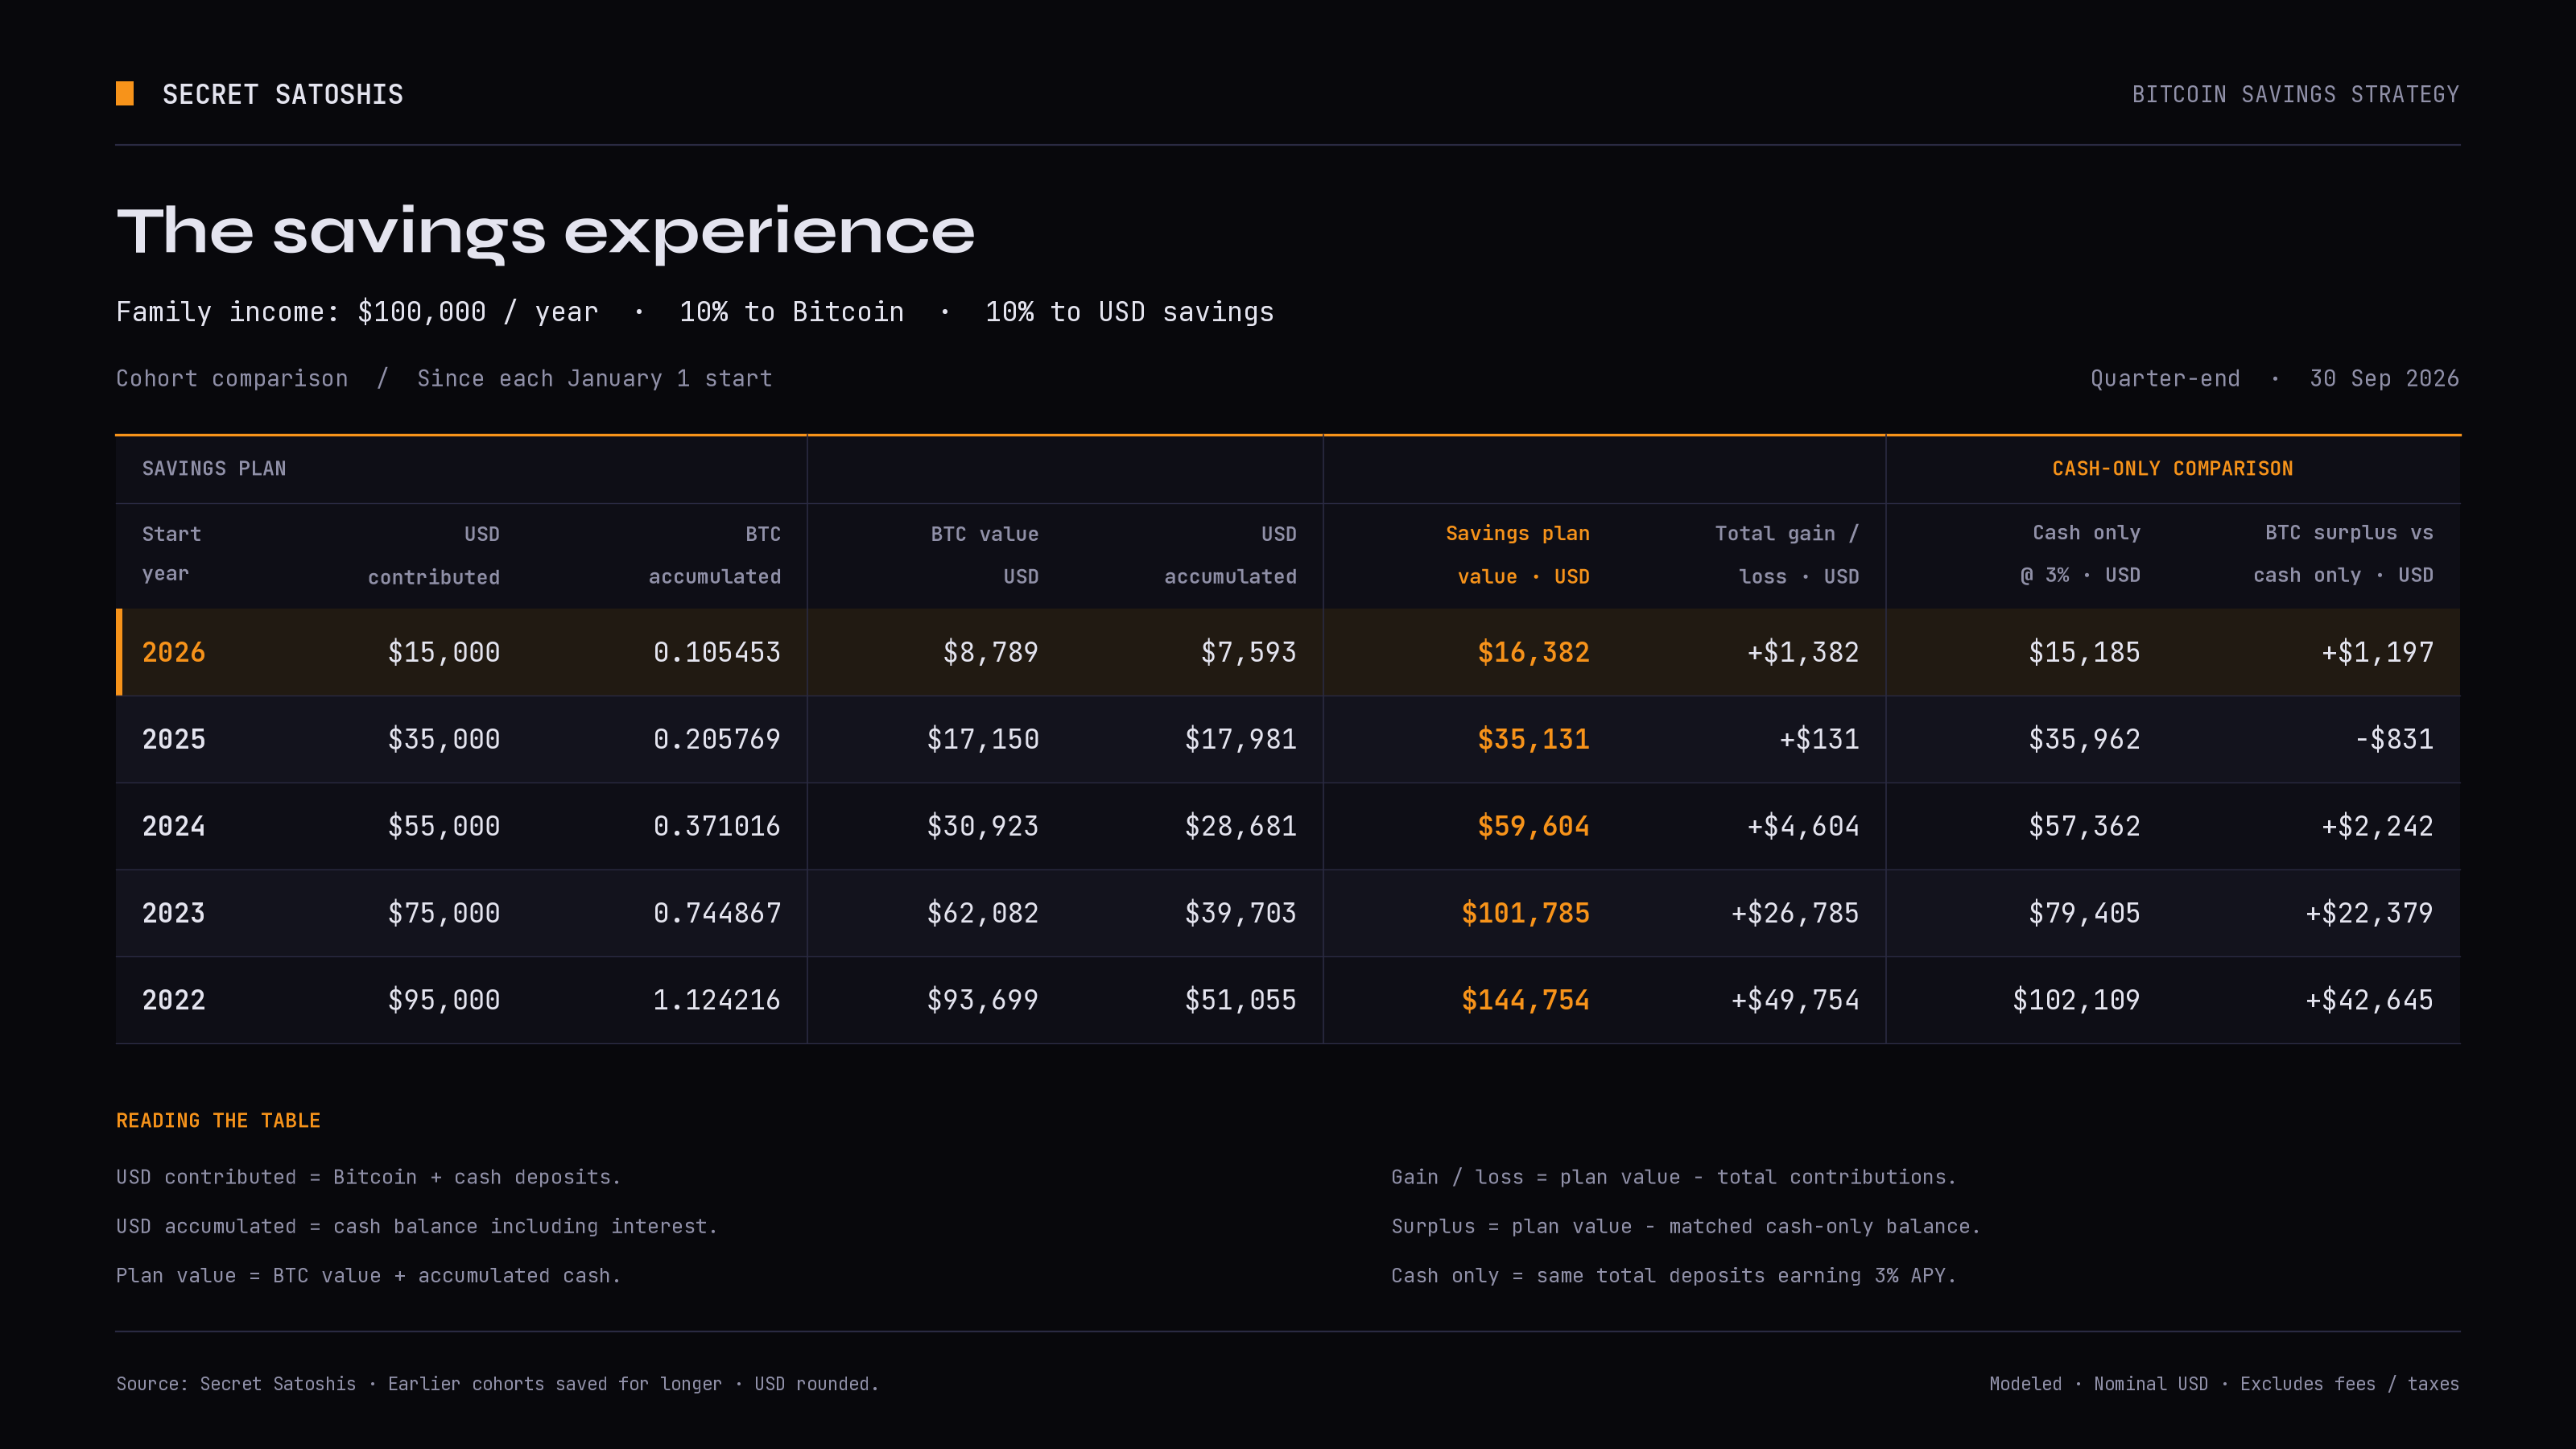
The results reinforce the strategy’s central principle: consistent saving builds Bitcoin ownership across market cycles, while cash reserves provide liquidity without requiring Bitcoin sales during periods of weakness.
We’ll revisit the annual cases and savings strategy in our year-end review. Until then, follow the latest developments and explore the charts below to track Bitcoin’s progress for yourself.
Follow Secret Satoshis on X for the latest developments

Explore the market data and charts featured in this issue on the Secret Satoshis Market Dashboard.